Embrace the Power of Structured Logging
Introduction to Structured Logging from a Developer Standpoint
Heredia, Costa Rica, 2022-12-03
Series: Everything About Logging, Article 1
In this article, we'll cover the concept of Structured Logging, how it differs from regular or "traditional" logging and what are the benefits of upgrading.
Structured Logging
The term logging refers to the action of recording activity. In the context of applications, this means recording the activity of the application. We usually want to know which areas of the application are used, sometimes even by whom, and if they are working as expected.
Traditionally (meaning over a decade ago), developers would create a server-sided folder (and then text files) or a database table to store said activity records to either fulfill audit requirements or to fulfill other requirements, like bug or error troubleshooting.
This traditional method had many pitfalls because, while the sought data was there, it was difficult to analyze or find it. For servers that have a lot of traffic, log entries would be in the millions of entries per day. Without a proper system to categorize or filter among those millions of entries, developers realized this was far from an ideal solution, so enter Structured Logging.
The more modern structured logging term refers to log data that has precisely specified values, i. e. structured. For developers, this is an easy concept: Instead of writing strings of freeform text to the log files or database tables, we want to write objects, where individual properties are easily found, categorized, aggregated, filtered, etc.
We are moving from this (sample log line):
2022-01-01T15:05:07 Fetching data from user with user ID abc
To this:
{ timestamp: 2022-01-01T15:05:07, message: Fetching data from user with user ID abc, userId: abc}
The same information is there, but now the recorded data has structure. NOTE: In the above example, I wrote it in a JSON-like form just to evoke in your mind the word objects. No matter what the format of the serialized data is, think of objects. Structured logging by itself does not impose a serialization or transport format or protocol.
Requirements of Structured Logging
Structured Logging does not impose a minimum number of properties, or that properties follow a particular naming convention. Most structured log stores don't care about the number of properties, their data types or even if every record has all properties present or not.
For common sense, however, you should at least include a timestamp value to be able to follow the logs chronologically. After all, a log entry is not a log entry unless it has a time stamp. Other than this (quite obvious) "requirement", we are pretty much free to send any properties we want to structured log stores (most of them anyway). We'll discuss these specialized services we are calling "structured log stores" in a moment.
FUN FACT: One of the log stores I know, New Relic, is Pascal Case-friendly when it comes to naming the properties. If a property is named
UserId, then New Relic's user interface will show the column name asUser Id, with a space between the capitalized words. I think that's a nice touch.
What Happens After We Upgrade?
Ok, so let's imagine I already convinced you to move to structured logging and now, instead of having a log file with human-friendly text lines, you have a log file with a bunch of say, serialized JSON objects. Now it's just harder to read, right?
Yes, indeed the created log file is harder to read. Not only that, the log may continue to be enormous for the naked eye, and you still are out of a way to quickly and efficiently consume this data to obtain relevant information.
This is why, when one decides to go for structured logging, one must also change the way logs are stored. Log files may continue to serve a purpose, but they probably can no longer be the main source of logging. They are dumb, have no structure by themselves and every application may choose to log things differently, making the implementation process a real pain, not to mention its development cost.
This is where specialized services we have called "structured log stores" come into play.
Structured Log Stores
There are several popular logging servers that store and process structured log data. The ones I currently know are SigNoz, Seq, New Relic and Kibana. The latter is, in a nutshell, a user interface to visualize Elasticsearch data.
NOTE: Kibana here is just the user interface. The actual log store is Elasticsearch. I do not know the details or how to set Kibana or Elasticsearch up as it is not in my scope of interest. As a developer, I merely make sure I post structured logs to the company-provided log store.
Of the aforementioned four, the former two are more lightweight, while the latter two are more "large enterprise"-focused. As a personal recommendation, go with Seq. It is readily available in Docker Hub and you'll have it running on your PC or even in your Kubernetes environment in minutes.
SigNoz, while it does look good and promising, is not as simple to test. I won't go over it here. If you are interested, by all means, test drive it and come back and tell me all about it. I just don't get in the mood for downloading and compiling source code just to test the application.
With a structured log store, one is relieved from the responsibility of setting up all the backend engine required to process, filter, extract and analyze data. All four available solutions mentioned provide user interfaces that allow viewing, searching and even plotting the data in a way that can be analyzed quickly and exactly. This is the ultimate goal of structured logging if you remember the discussion at the start of the article.
Ok, Structured Log Store is Set Up. Now What?
This is the fun part, in my opinion. You are ready with a log store (and a corresponding front end), and that means your system, be it a monolithic server application, a microservices distributed application, or even a desktop application, can start sending structured log entries to this log store. Once this is happening, you will enter a beautiful world.
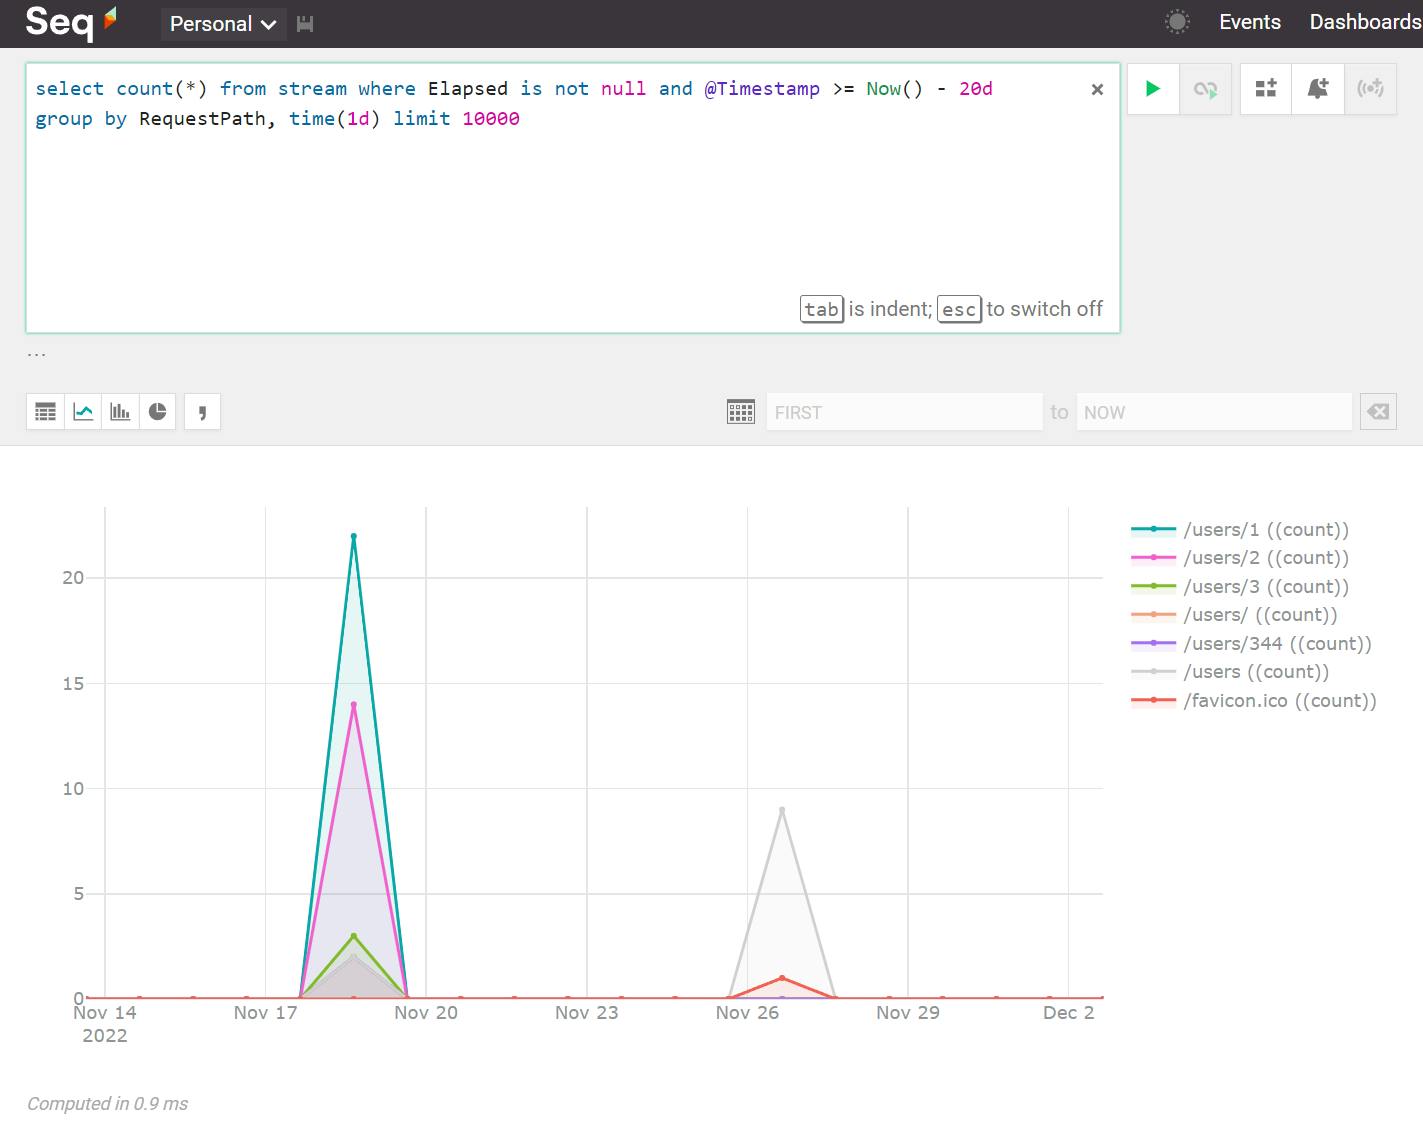
A picture is worth a thousand words, so let me show you a picture, using Seq, of a line chart I created by counting the number of times different backend URLs were queried.

For completeness, here's the "SQL" query used to create the chart:
select count(*) from stream where Elapsed is not null and @Timestamp >= Now() - 20d group by RequestPath, time(1d) limit 10000
Simple, right? Yet so powerful! This is just a tiny something of all the things you can find out by analyzing the logged data. Let's do one more example.
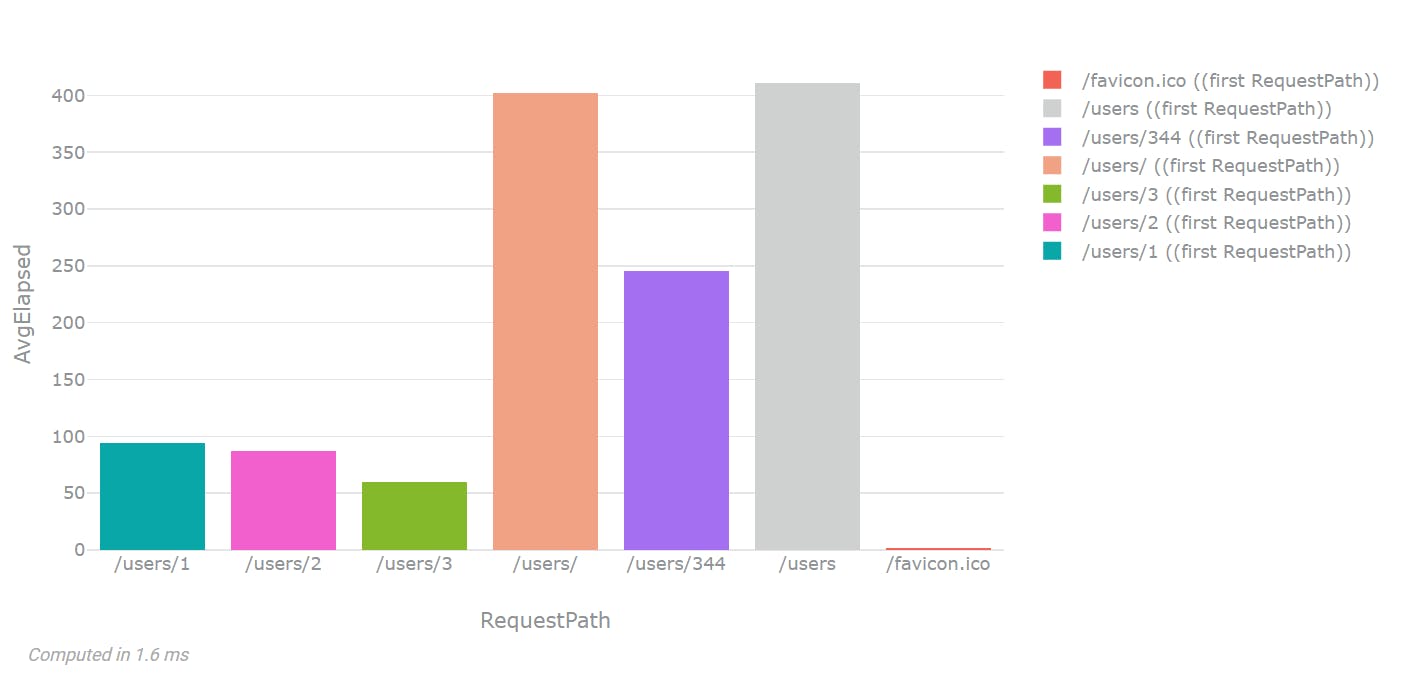
This is the average elapsed response time of all the HTTP requests I did in a certain timeframe. The chart tells me I have a very fast API server: All users returned in under 400 milliseconds. Good job, ASP.Net.

Here's the query for the bar chart:
select RequestPath, mean(Elapsed) as AvgElapsed from stream where Elapsed is not null and @Timestamp >= Now() - 20d group by RequestPath
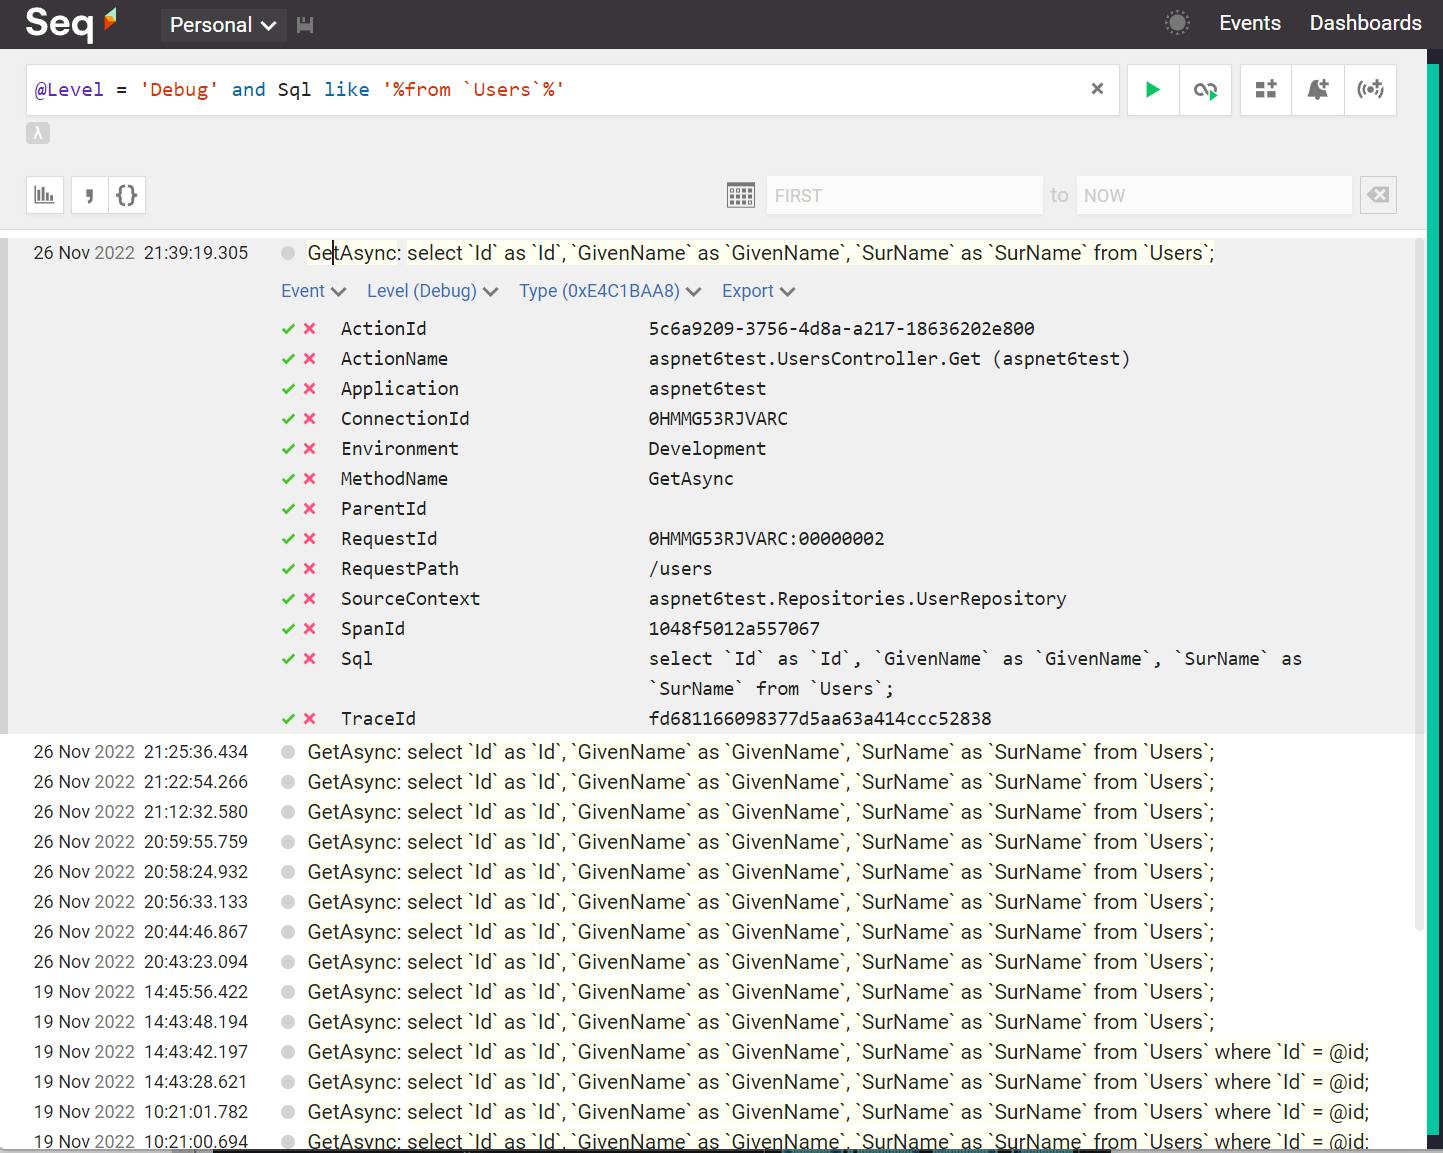
Of course, creating charts is not the only thing you can do. You can browse and filter the collected logs. This is a screenshot of the events, filtered to show only debug entries that contain a property named Sql whose value contains the table Users:

In the screenshot, the sub-table after the first record row is the list of individual properties contained in that first log record. Any properties found here can be used as part of the filter typed on top.
The checkmark and red X icons to the left of the property can be used to quickly filter by that property (and property value).
Test-Driving Seq
If you want to test drive Seq, the process is super simple using Docker Desktop.
Install Docker Desktop on your PC.
Open PowerShell (or your favorite terminal), and run
docker run --name seq -d --restart unless-stopped -e ACCEPT_EULA=Y -p 5341:80 datalust/seq:latest.
That's it! You can now send logs and query the logged data through the URL localhost:5341.
NOTE: If you want to know more about how to run and configure Seq in Docker Desktop, follow this link.
Sending Log Data
This would be the final piece of the puzzle, but unfortunately, it will be covered in the coming articles, so be sure to follow the series. It is pretty simple, though. There are ready-made libraries for different programming languages that do the job for you, and even if there weren't, usually sending logs is as simple as serializing the data in JSON format and POST'ing it to the log store via an HTTP request. Each log store is different, however, and some require license API keys to be included in the HTTP request.
In the following articles in this series, I'll be detailing the practical aspects of implementing structured logging in .Net projects, NodeJS projects and even from browser clients.
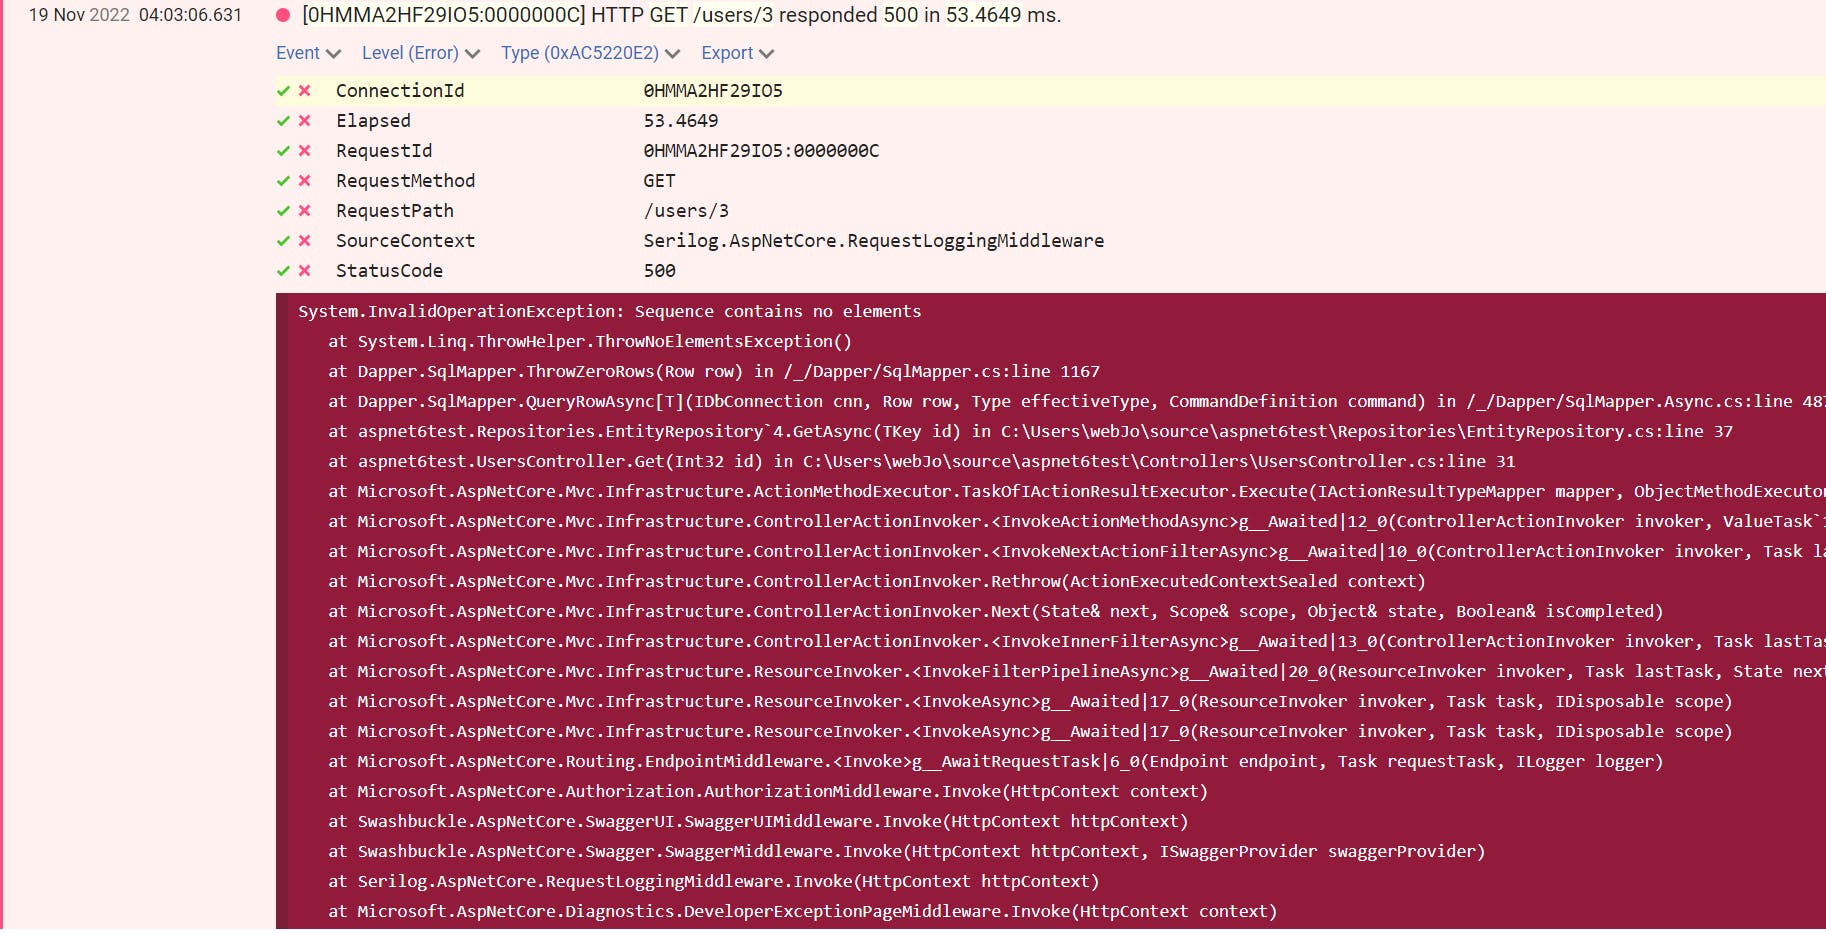
Hopefully, this article has allowed you to realize how useful structured logging can be. While this article focused more on statistics and metrics, it is just as useful when troubleshooting errors. Exceptions are usually stored in the log store, allowing developers easy access to the stack traces and error-specific information. If you are smart about it, your log entries will include a source context (which is the full class name in .Net) and a method name, making it almost a trivial task to locate the incriminating source code around the exception.
To leave you now on a high note, here's a screenshot (once again, of Seq) showing a log entry that contained an exception:

Happy coding, everyone.
